What is BETA in Finance and Investments
Beta as used in finance, investing, and stock trading refers to the risk exposure of a specified financial asset in relation to the overall market, otherwise referred to as systematic risk.
Systematic risk could also be defined as undiversifiable risk; this is the risk that cannot be eliminated by increasing the diversification in a portfolio, through adding more stocks or financial instruments.
Beta coefficient or systematic risk in stock trading can be calculated by doing a regression analysis of a specific company stock for example Tesla (TSLA) and the market for example the S&P500 financial index; in this case, the slope from the regression line represents the beta. (Further in the article you see a demo on how to calculate beta using different methods.)
An individual financial asset could be any identified stock that an one is looking to analyze such as Apple (AAPL), Microsoft (MSFT), Tesla (TSLA), GameStop (GME); while the “market’’ is a financial instrument that represent a certain economy or industry; usually indices (Index) are used in this case, such as the S&P500 (SPX/SPY), NASDAQ, Dow Jones Industrial Average (DJIA), etc.
Other Risks That Affect a Company’s Stock Other Than Market Risk, Systematic risk
Inflation risk explains how the purchasing power of customers shifts in relation to the changes of one unit of exchange (Currency) over time.
Read: The Relationship Between Interest Rates and Inflation
National disasters (pandemics) include natural disasters such as heavy storms that cause harm and damage to property, infrastructure, and affect the overall well being of a nation (s).
Political instability and unrest are mainly attributed to elections, and results that citizens generally disagree with, and as a result cause riots, rallys, interpersonal fights, and looting; causing a season of economic downfall.
Exchange rate risk affects how a company’s income is affected by the variables they hold in foreign currency, this is because exchange rates in the forex market tends to fluctuate, and could be unpredictable at times; and as such the value of these assets may decrease or increase significantly based on that volatility. Companies however could use derivatives such and futures contracts and forward contracts to hedge against this foreign exchange risk.
Unsystematic risk on the other hand defines the risk specifically associated with an individual company or a certain industry, and thus it could be hedged, eliminated, or reduced by diversification; for example by holding more financial instruments.
How to Interpret BETA Coefficient as a Financial Analyst
Since the measurement of a stock beta is calculated using the market as a benchmark, the market’s beta will always be one.
Therefore all values are analysed from how far or close they are from one. (And whether they are above or below one).
If the stock has a beta of more than one, it shows that the financial asset is more volatile than the market, therefore investors expect more returns than what the market would offer if they decided to invest in that stock (because of taking up the extra risk.)
If the beta of the select stock is less than one, it indicates that the stock has less volatility as compared to the market and therefore is less risky, and as such, investors would expect the stock to have lower returns compared to the market due to the low risk associated with the financial asset.
If a company’s stock has a negative beta coefficient, it means that the market and the stock are inversely correlated, where-by if one moves up the other moves down; therefore if the market moves up, the stock would tend to move in the opposite direction with the proportion of its negative beta.
3 Ways to Calculate BETA of a Stock Using Real Example on Google Sheets (Excel)
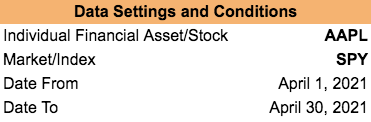
To illustrate the different ways of calculating beta we shall be using 1 month historical daily close price data, i.e; From 1 April 2021 to 30 April 2021, of the Standard and Poor’s 500 (S&P500) market index and Apple (APPL) company stock.
Historical financial stock trading data can be retrieved from multiple reliable sources such as Google Finance, Yahoo Finance, Bloomberg, etc.
Read: A Simple Description of the S&P 500 Index and How It Eliminates Market Risk
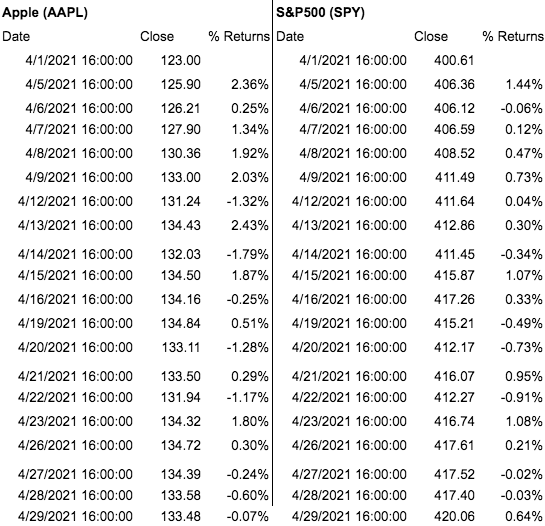
In this demo we shall use Google Finance as our source (Using the GOOGLEFINANCE function to fetch prices to Google Sheets).
Returns are calculated by taking the current stock close price minus previous stock close price and dividing that answer with the previous stock price. That is;
% Return(s) = (current stock close price – previous stock close price) / previous stock price
You can either leave the answer as a fraction if you understand how to handle it like that, or you could change to percent by multiplying it by 100 or using the “%” function on excel/google sheets.
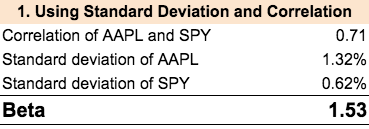
- Beta formula using correlation and standard deviation
In this section we shall calculate beta by understanding the relationship between beta and correlation.
To calculate beta using correlation and standard deviation, we need to calculate the correlation of the financial asset (stock) and the market (index).
Then we multiply the obtained correlation with the standard deviation of the financial asset (stock) divided by the standard deviation of the market (index).
Beta = CORRELATION(Stock Returns, Market Returns) x [STANDARD DEVIATION(Stock Returns) / STANDARD DEVIATION(Market Returns)] - Using covariance and variance to calculate beta
The way to calculate beta with covariance and variance, is that you get the covariance of the selected stock’s return to the market’s return, and divide this by the variance of the selected market’s return.
Beta = COVARIANCE(Stock Returns, Market Returns) / VARIANCE(Market Returns)

- Using regression analysis to calculate beta
Regression analysis involves an outlook of a dependent variable and an independent variable (s).
In calculating beta using regression, we regress using the stock as the dependent variable, and the index as the independent variable, and just to note in this case it’s a simple linear regression.
Beta, using simple linear regression, is represented by the slope. Which can be easily calculated using the SLOPE function in excel/google sheets.
Beta = SLOPE(Stock Returns, Market Returns)

As you can see, from the 3 methods used, we achieved the same value for beta.
Full Overview (Summary) of the Calculations
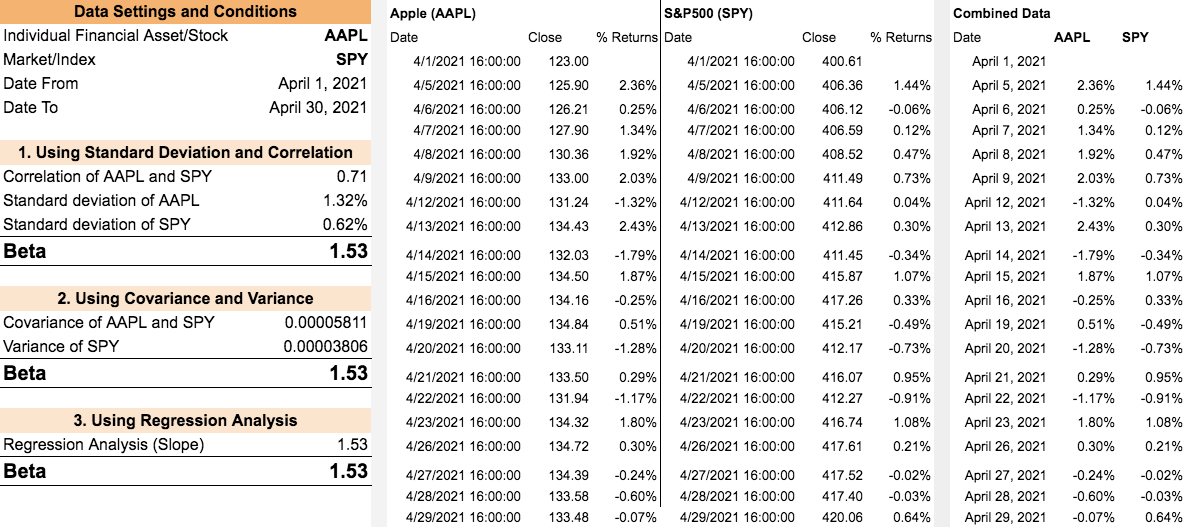
You can access the calculations and data from this google sheet: For Public – Calculating Beta Using Different Methods – FinanceBeta (If you would like to modify, please make a copy, then do so). Please note that this is just for demonstration purposes. Also, one can replicate these calculations in excel.
How to Easily Calculate Beta of a Portfolio Using a Simple Example
To calculate the beta of a portfolio, one needs to calculate the beta of each stock (similar to the examples and methods used above); then multiply each beta by the weighting (or percentage) that the stock holds in the portfolio – this equals a weighted beta for each stock; one then needs to sum up the weighted beta of each stock – that final sum is the portfolio’s beta.
The sum of the weighted beta of each stock in the portfolio is the portfolio’s beta.
For example: Suppose a portfolio that holds three stocks; Apple (AAPL), Tesla (TSLA), and Amazon (AMZN), with a portfolio weighting of 35%, 25%, 40% respectively.
Using 1 month historical daily close price data, i.e; From 1 April 2021 to 30 April 2021, of the three stocks and Standard and Poor’s 500 (S&P500) as the market (index). The calculation of Beta, Weighted Beta, and Portfolio Beta will be as follows:

How BETA Is Used in the Capital Asset Pricing Model (CAPM)
Beta is used in the calculation of Capital Asset Pricing Model (CAPM), in the calculation of expected return.
CAPM is used in the calculation of Weighted Average Cost of Capital (WACC) as the expected return (Cost of equity) of assets.
The formula for calculating CAPM involves beta, market-rate of return, and risk-free rate (The risk-free rate mostly used is the percentage yields from government bonds, usually ones that are more than 10-years.
The formula is defined as;
CAPM (Cost of Equity) = Risk Free Rate + [Beta x (Market Returns – Risk Free Rate)]
The variables can be represented as:
Ra = Cost of Equity
Ba = Beta
Rrf = Risk Free Rate
Rm = Market Returns
Note: Market Returns minus Risk Free Rate (Rm-Rrf) defines the Risk Premium.
WACC is used in the Discounted Cash Flow (DCF) model as the discount rate.
DCF model is used in the valuation of company stocks to discount expected future cash flows to the present, and deciding whether it is feasible to invest in that company based on the value.
How to Use Beta Effectively to Eliminate Risk in Trading
Investors typically hold multiple investments of different kinds of financial assets in their portfolio.
Financial assets may include stocks, bonds, forex, ETFs, indices, among others; this is mainly for the purposes of eliminating risk or spread it across the different investments, which is referred to as diversification.
By using beta to diversify or eliminate (Reduce) risk, investors may decide to invest in financial assets (company stocks) that have a beta lower than one, even though these investments may not yield high returns, doing this will ensure the investor’s portfolio will be less affected incase the market experiences a high volatile situation on the downside (for example during a financial crisis, such as the 2008 housing crisis) whereby these stocks are less affected.
Investing in high beta stocks is more efficient during times of bullish market trends, because the market is doing well, thus the companies are expected to yield higher returns than the market’s, therefore investors anticipate high returns.
To effectively use beta, investors would hold a combination of low and high beta companies, that is companies that have beta(s) that are lower than one, companies that have beta(s) that are higher than one, and sometimes even companies with negative beta(s).
This ensures that the investor’s portfolio is protected in times of tough financial conditions, this is with the guard that the low beta company stocks provide.
And; the portfolio performs relatively better than the overall market when the overall financial environment is booming supported by the high beta stocks.
Advantages of Using Beta Coefficient in Investing
Beta gives a more standardized methodology of understanding the overall market and effects it could have to one’s invested stocks (As it gives an investor a quick overview of the expectations on an investment and the risk exposure.)
Beta helps analysts to easily calculate the return on equity, through the input of beta coefficient in the calculation of CAPM.
Beta can help investors reduce risk by holding stocks that have a beta of less than one.
Generally, the beta coefficient is easy and simple to calculate and interpret. (We can agree to disagree on this point).
Limitations of using BETA in Trading
Calculation of beta involves using stock market historical prices, which are not fully indicative of future prices.
Beta only takes into consideration systematic risk (Market risk) which does not take into consideration risk specifically incurred by the company, financial asset, stock; such as spin-offs, significant increase in revenues, changes in management, insider transactions, e.t.c.
Different analysts use different timeframes, and period sets to calculate beta; for example one may use daily data for the past three months, another one may use weekly data for the past 2 years, even though both scenarios may use the same financial assets for comparisons, the results may differ significantly.
Beta usually reflects the risk exposure in the near term and does not take into consideration the long term exposure; this is because it changes overtime, therefore it may only be highly useful to short term investors and not long term investors.
Summary and Conclusion
Beta coefficient plays a major role in the financial industry as it can be used not only as a measure of risk but also in combination with other financial models to further a research or analysis.
Investors can use beta to quickly check whether the risk they are taking up is worth the investment and whether they are being compensated for taking up the extra risk; based on this they can adjust accordingly.
Also, smart investors can take advantage of stocks whose beta are close to the market’s (one), but offer more returns overall; this is because they would be getting more returns than the market but with the same (similar) level of risk.
Using portfolio beta, investors can reduce the risk exposure that they hold on individual stocks that may have high betas.
Data sources and References


Pingback: Breaking Down the Beta Coefficient: Understanding Its Significance in Financial Analysis and Risk Management - FinanceBeta